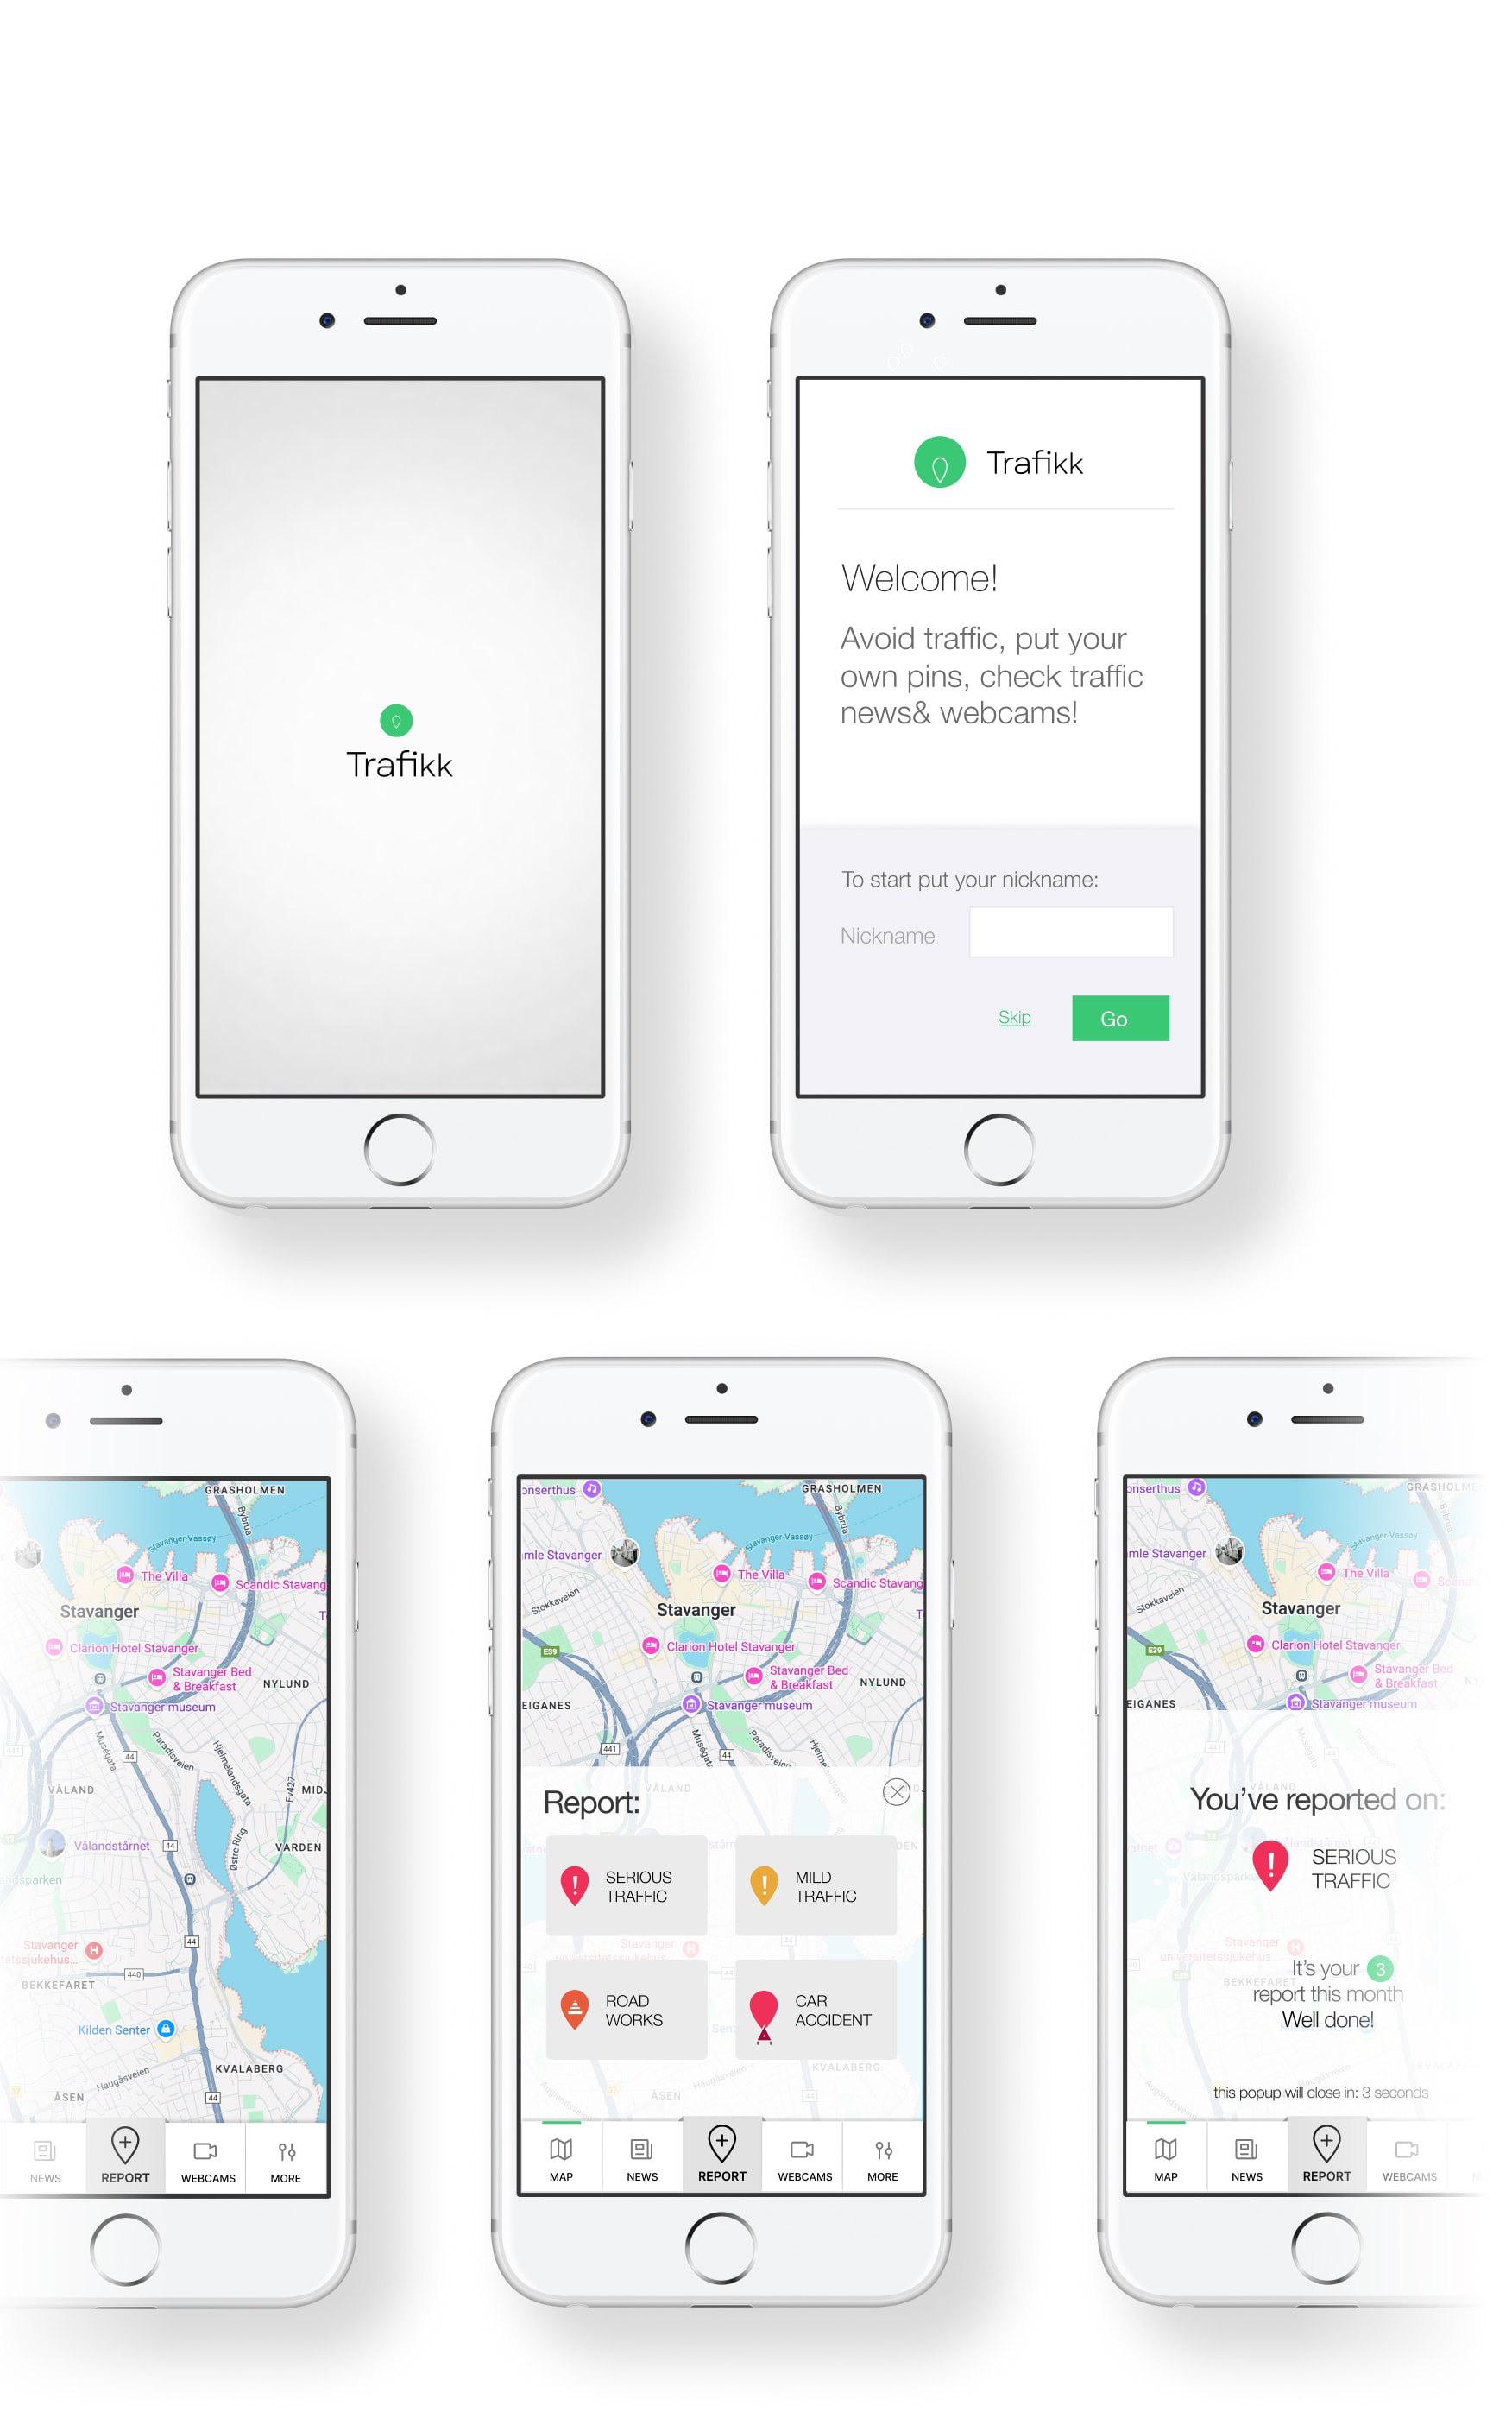
Traffik
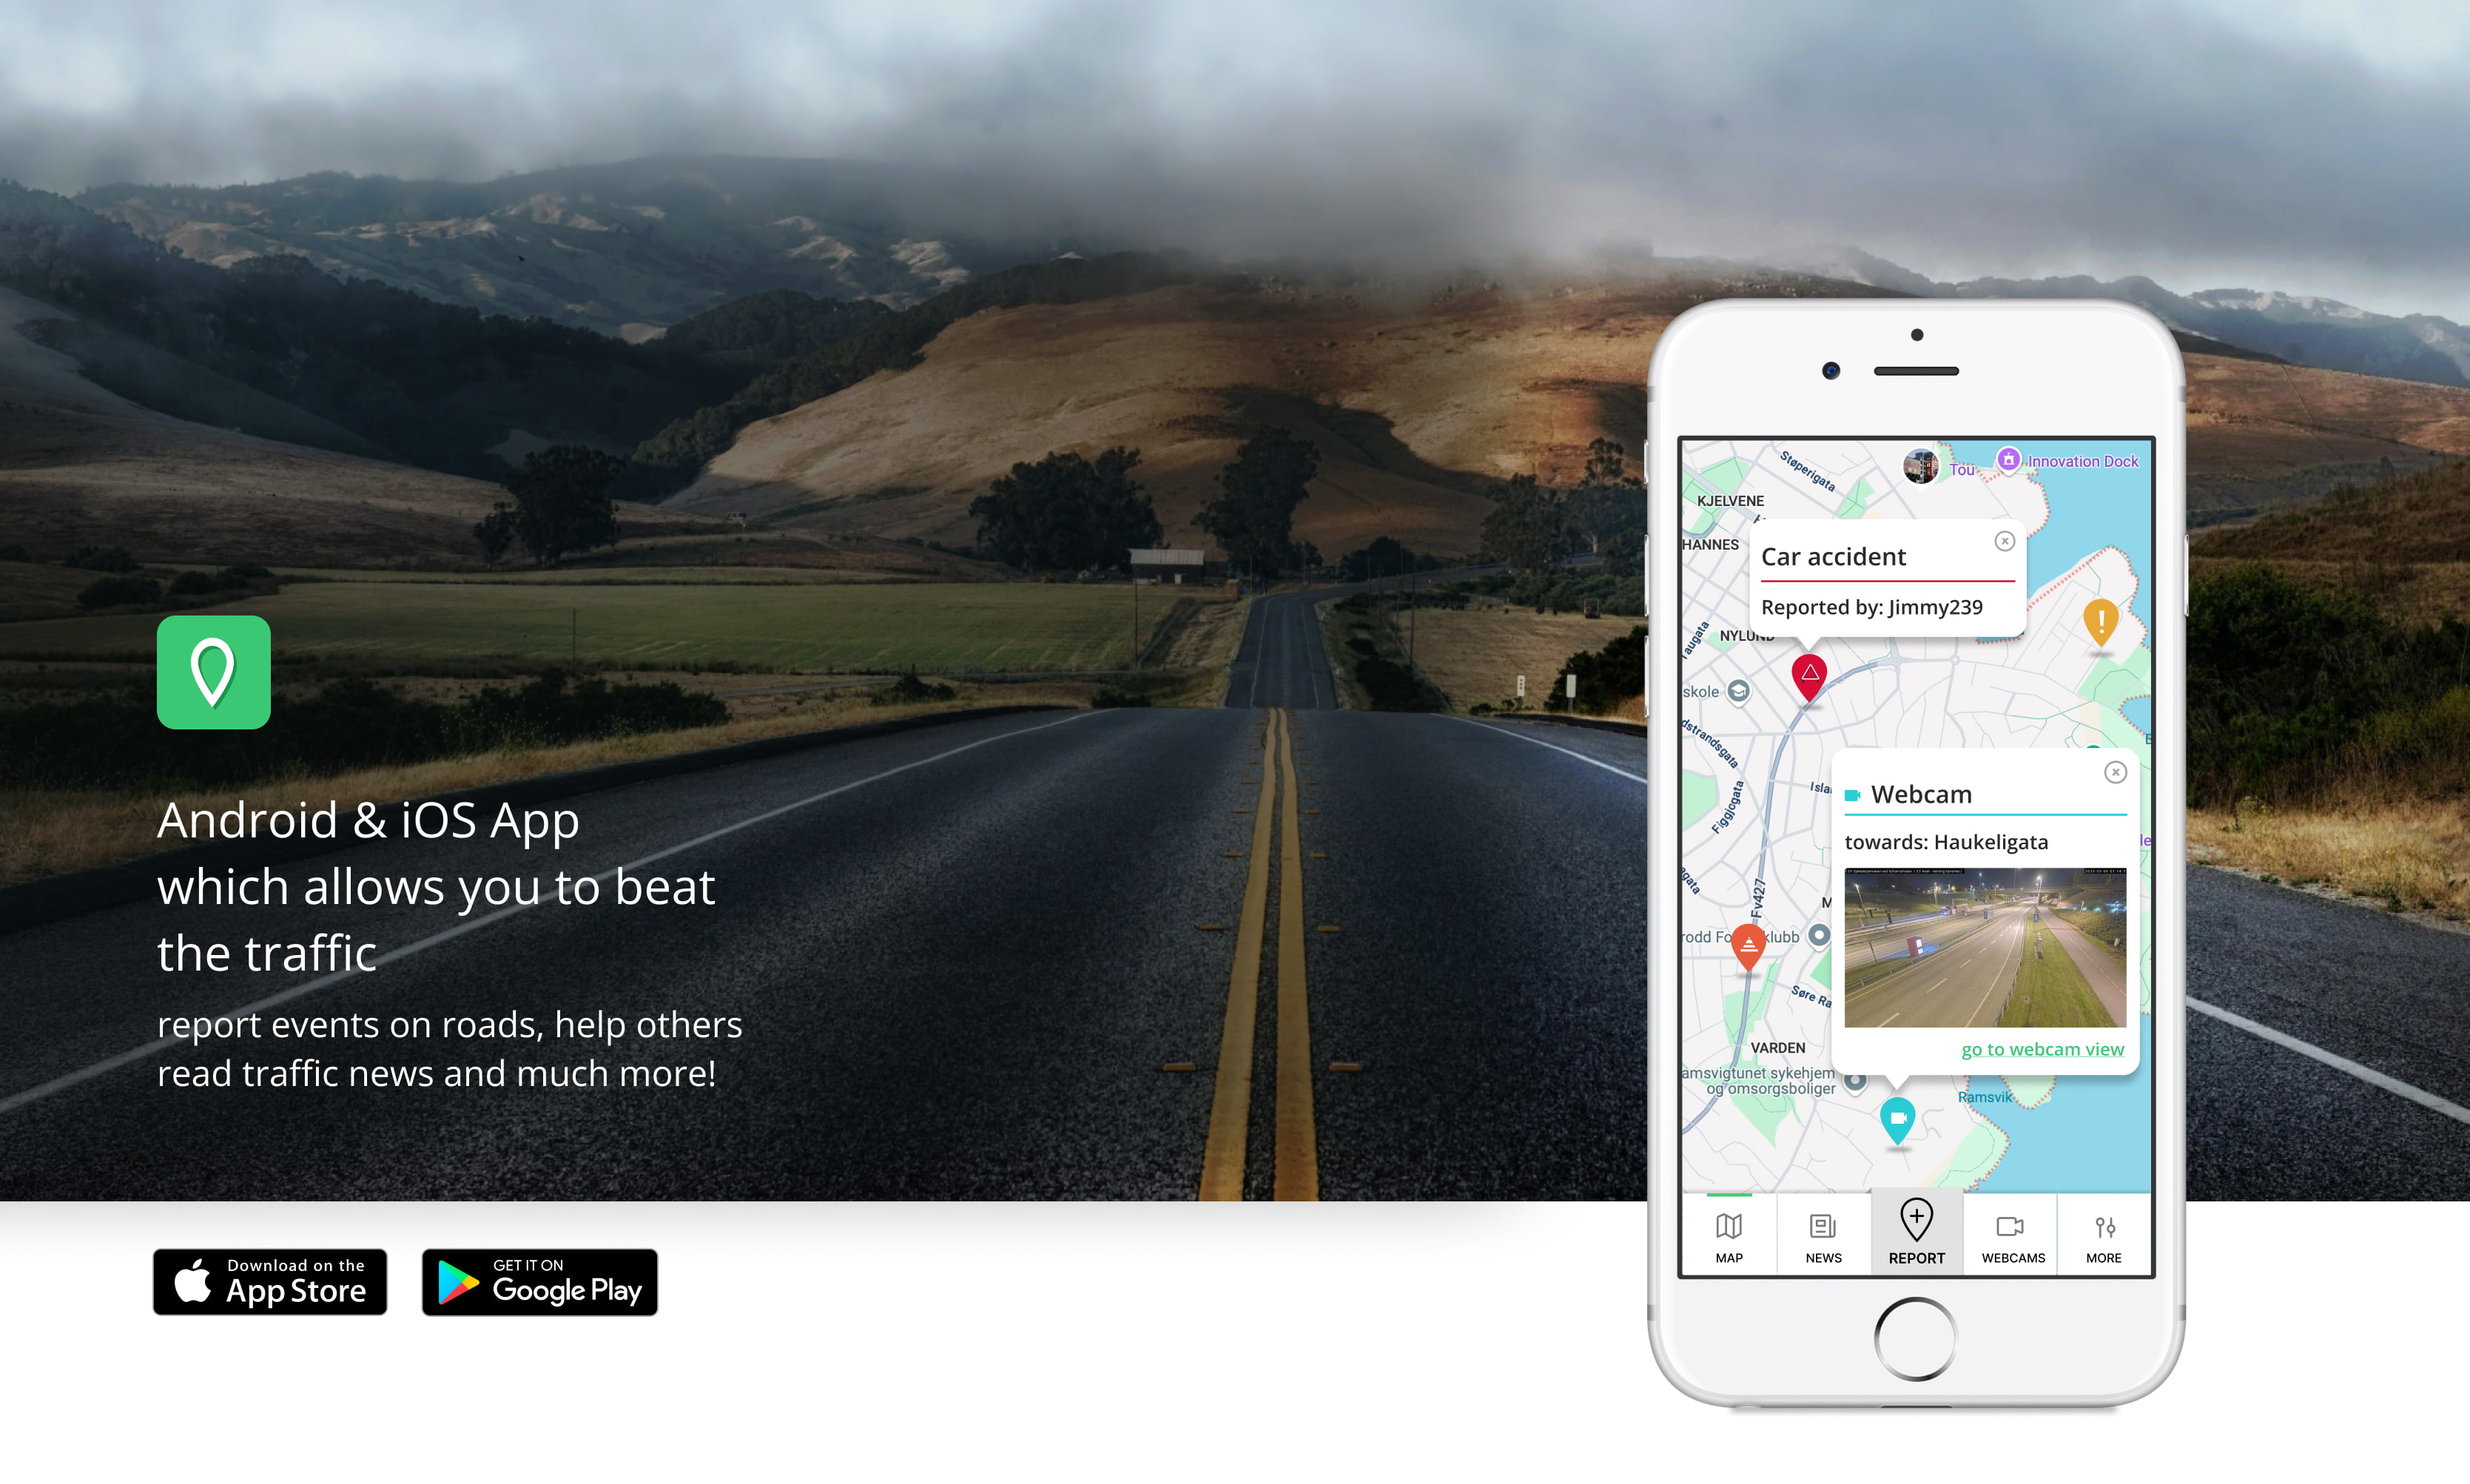
Mobile app that helps users navigate traffic in the Stavanger area
- Gathered requirements, conducted competitive analysis, and performed user testing. Created an empathy map
- Conducted prototype feedback & testing, in-person usability testing - in Balsamiq, InVision and in the app after launch
- Designed the logo, app icon, mobile app, and landing page
Client: Schibsted Media Group
Timeframe: 2.5 months
Target group: Smartphone owners aged 12–60
Our team: 1 PM, 1 Tech Lead, 3 developers, 1 UX & Graphic designer (me)
Problem statement
Stavanger is the fourth largest city in Norway. It is home to many oil companies and as a result traffic congestion is significant. The traffic is particularly bad during rush hours. Existing tools like Google Maps mainly focus on major roads, leaving smaller streets — often used as detours — unaccounted for.
Possible solution
Our client wanted to build an app that would allow people to beat the traffic. The app would show traffic on small roads and allow users to report traffic jams, accidents, road works and other situations.
Competitive Analysis
I conducted competitive analysis on our closest rivals, Google Maps and Waze, and discovered a critical gap: neither platform effectively monitored conditions on smaller streets.
Google Maps
- Key Features: Turn-by-turn navigation, public transit integration, Street View, and a robust search engine for Points of Interest (POIs).
- Strengths: Highly trusted, reliable ETAs, and excellent integration of static business data (gas stations, parking, restaurants).
- Weaknesses: Google Maps did not feature live, user-generated incident reporting. Its traffic data was mostly passive and slow to update real-time micro-incidents, leaving smaller detour streets completely unaccounted for.
Waze
- Key Features: Gamified crowdsourced reporting (police, hazards, accidents), aggressive automatic rerouting based on live speeds, and social map interactions.
- Strengths: A strong community aspect with excellent user participation and time-saving route optimization.
- Weaknesses: The interface felt highly cluttered and distracting while driving. Furthermore, its aggressive rerouting often pushed too many cars onto small residential streets, creating new traffic jams that the app then struggled to monitor effectively.

We realized that people were actively trying to avoid traffic by taking detours, only to become stuck in even worse traffic on unmonitored local roads. This validated my conclusion that our core differentiator had to be crowdsourced reporting.
Persona
To ensure our design decisions were rooted in real user needs, I created an empathy map built around a primary persona, which I called "Stian." Stian represented our target commuter and helped us deeply understand our users' daily goals, needs, and frustrations. With Stian in mind, we were ready to brainstorm the app’s key features.
The scope
I carried out an extensive brainstorming session to gather all potential ideas, which included:
- displaying a map with pins
- train delays
- route optimization
- roadworks timelines
- accident reporting
- a blocky driver-friendly interface
- relevant news
- webcam integration
- a night mode
Because not every feature could be easily developed, it took several weeks to estimate costs. Due to budget constraints, I worked with the product manager and the client to scale the project down to its core MVP features for the first stage:
- Displaying a map with interactive pins
- Displaying accidents and roadworks via pins
- Allowing users to report situations on roads
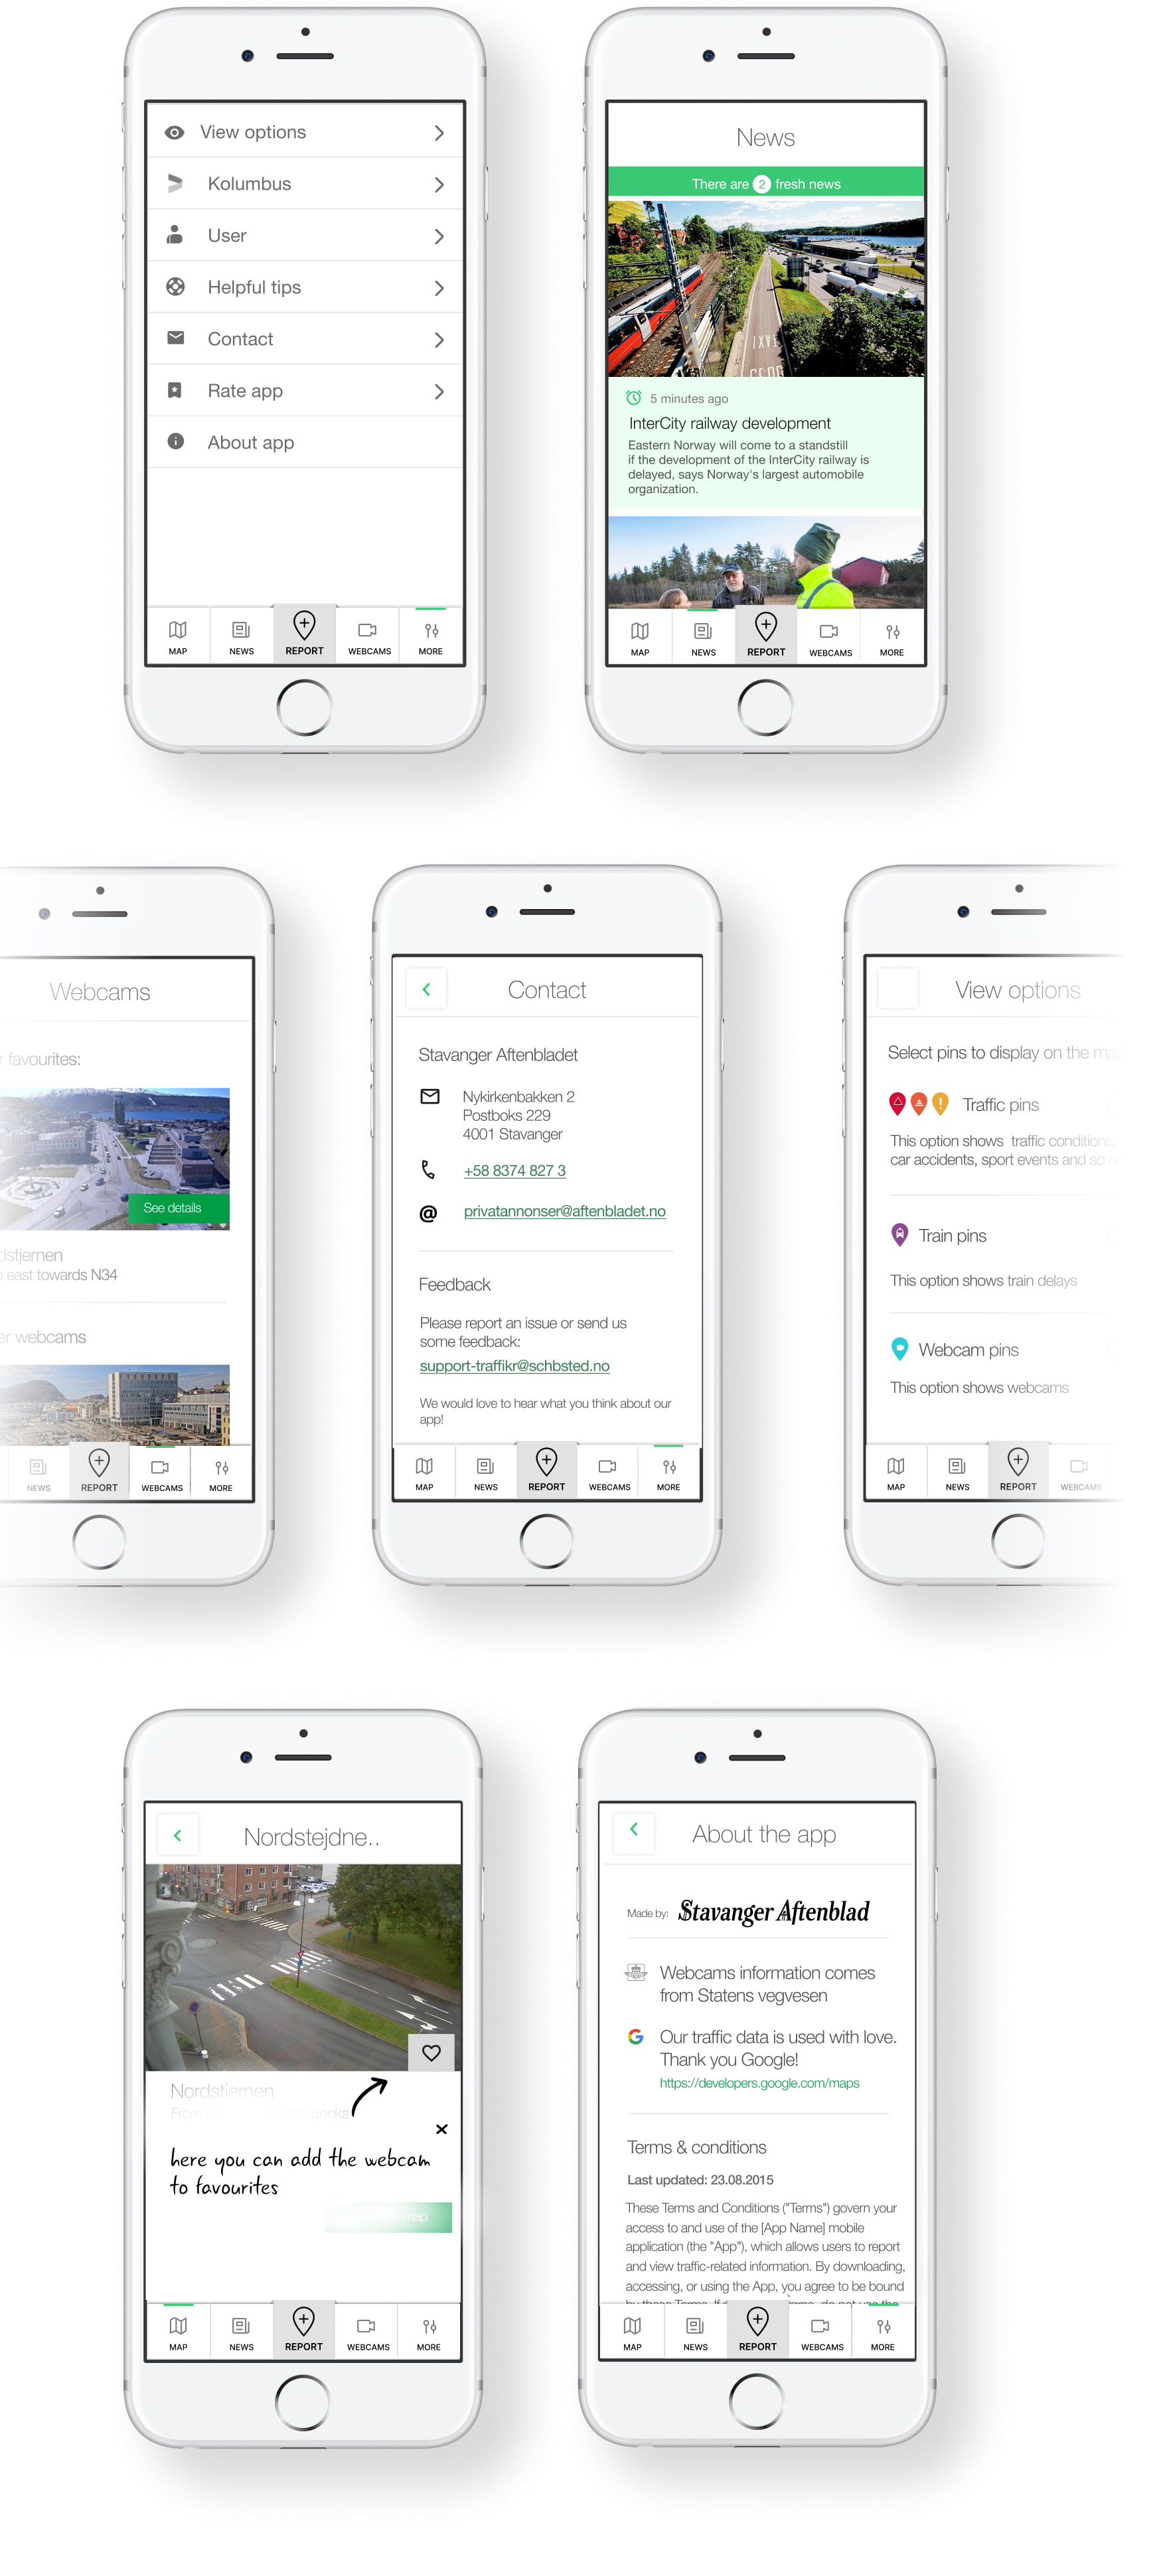
- Displaying city webcams and relevant news
Designing the flow & wireframing
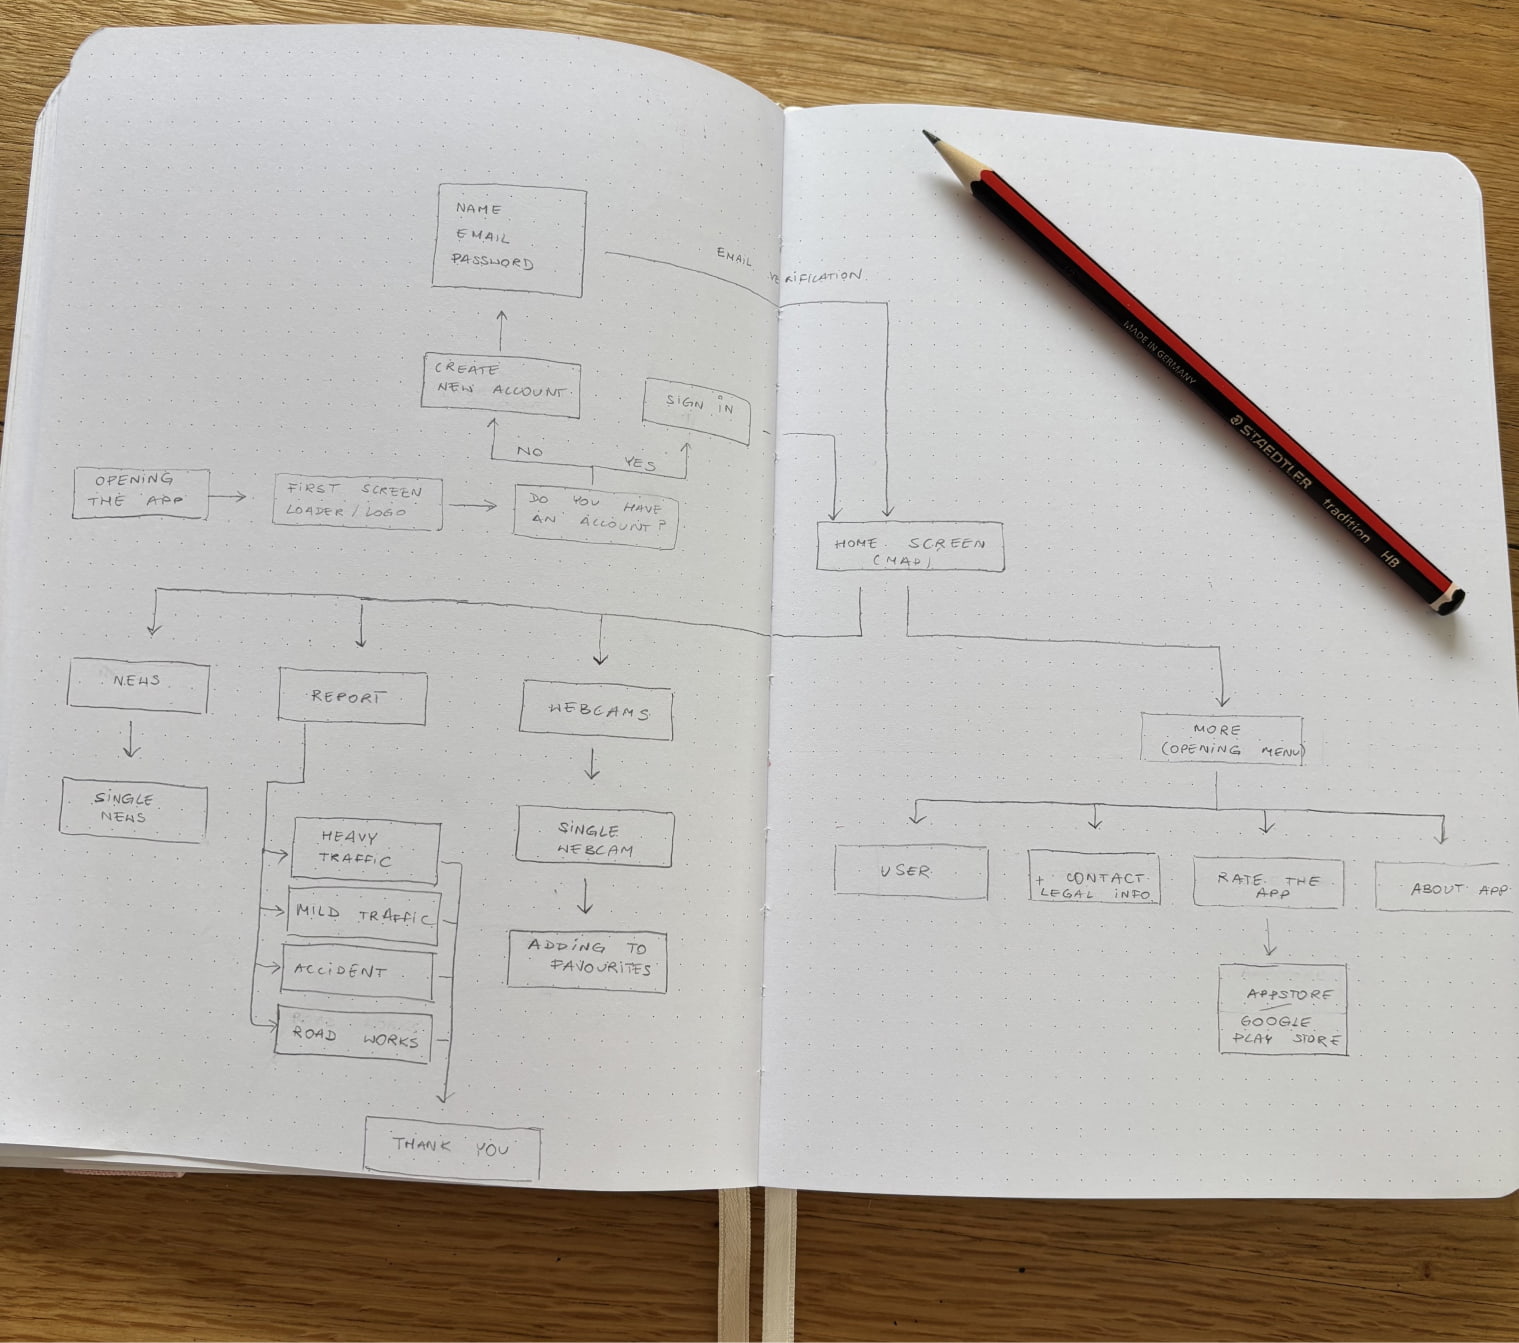
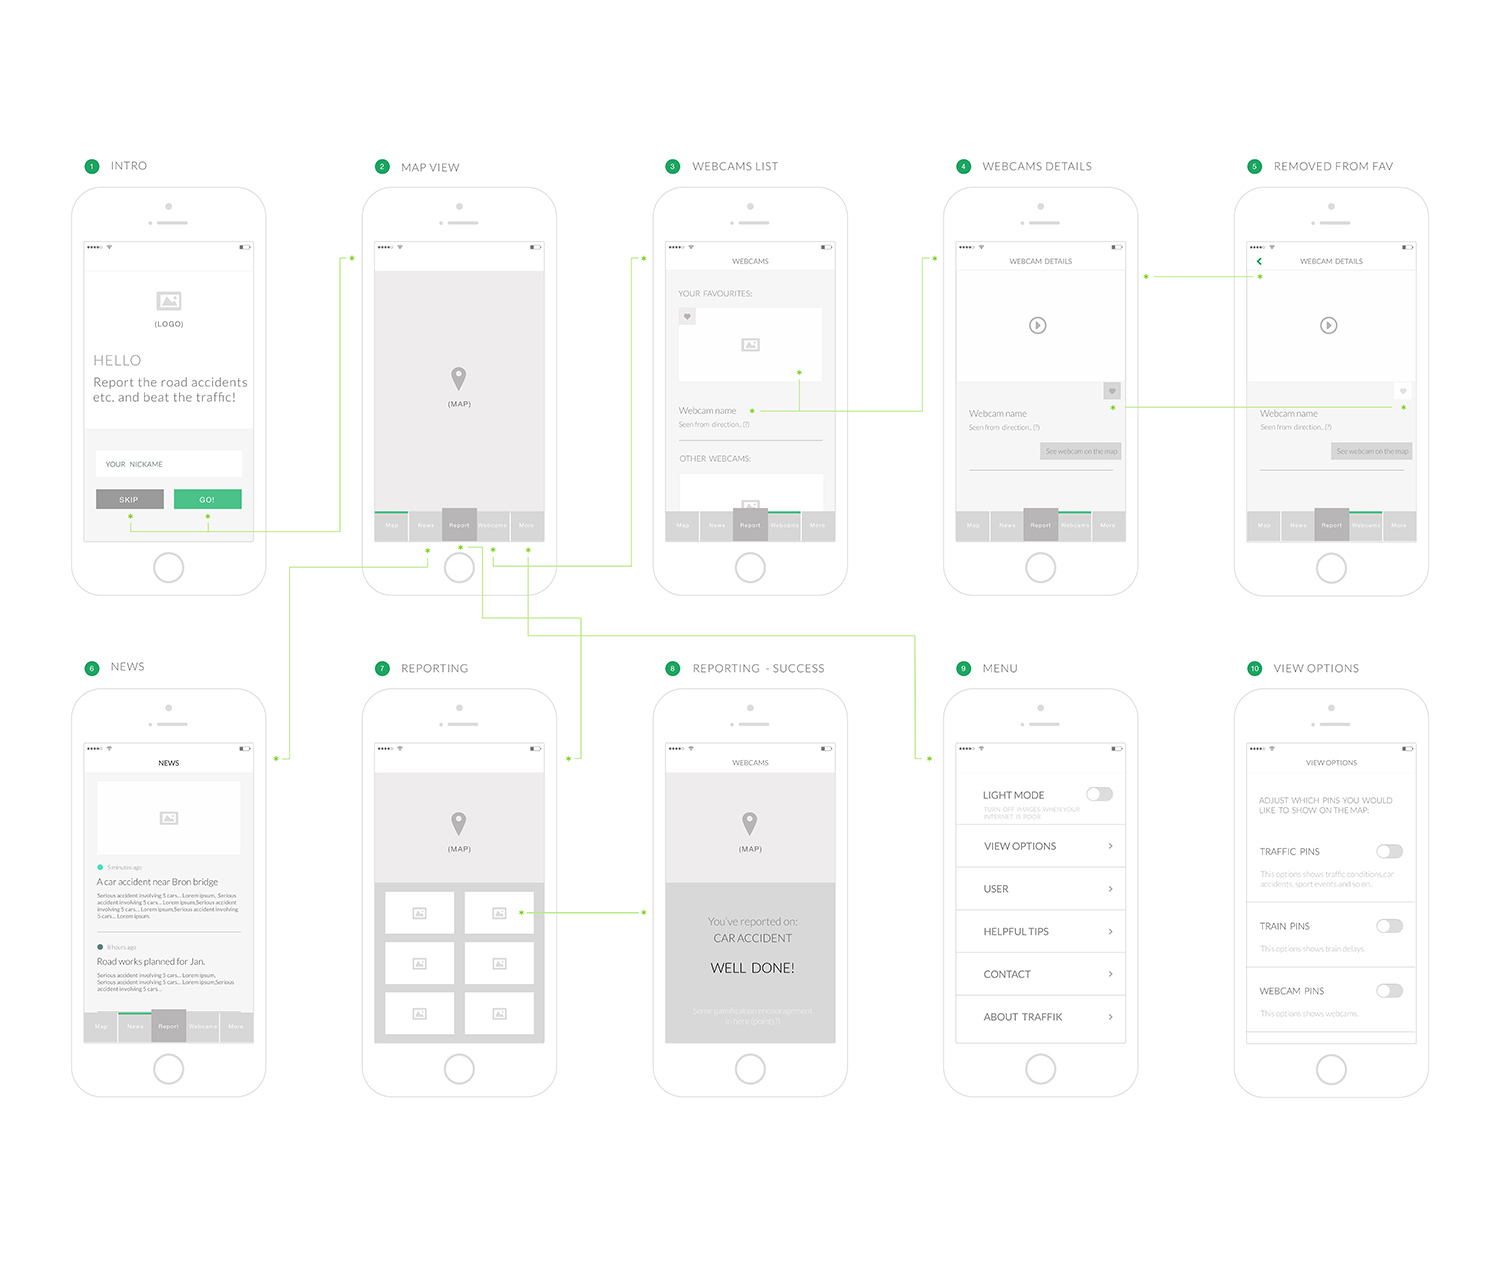
I led the end-to-end design process by mapping out the initial flow on paper. Once the core user journey was established, I used Balsamiq to create basic structural wireframes. Finally, the polished, high-fidelity version of the app was designed and prototyped in InVision.
Designing the menu
The menu design went through several iterations. Following UX best practices for mobile reachability, I anchored the menu at the bottom of the screen so users could easily access it with their thumbs.
First attempts...
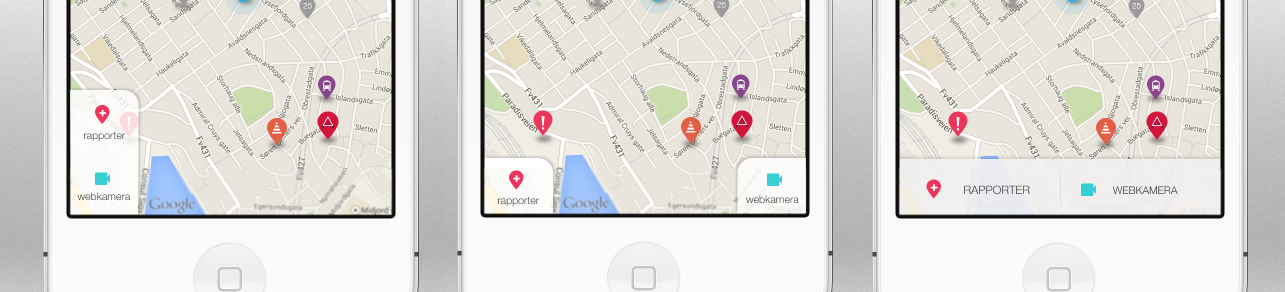
and some testing led me to:
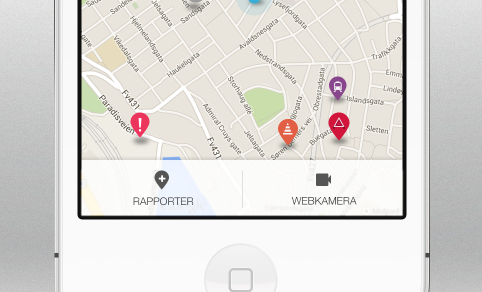
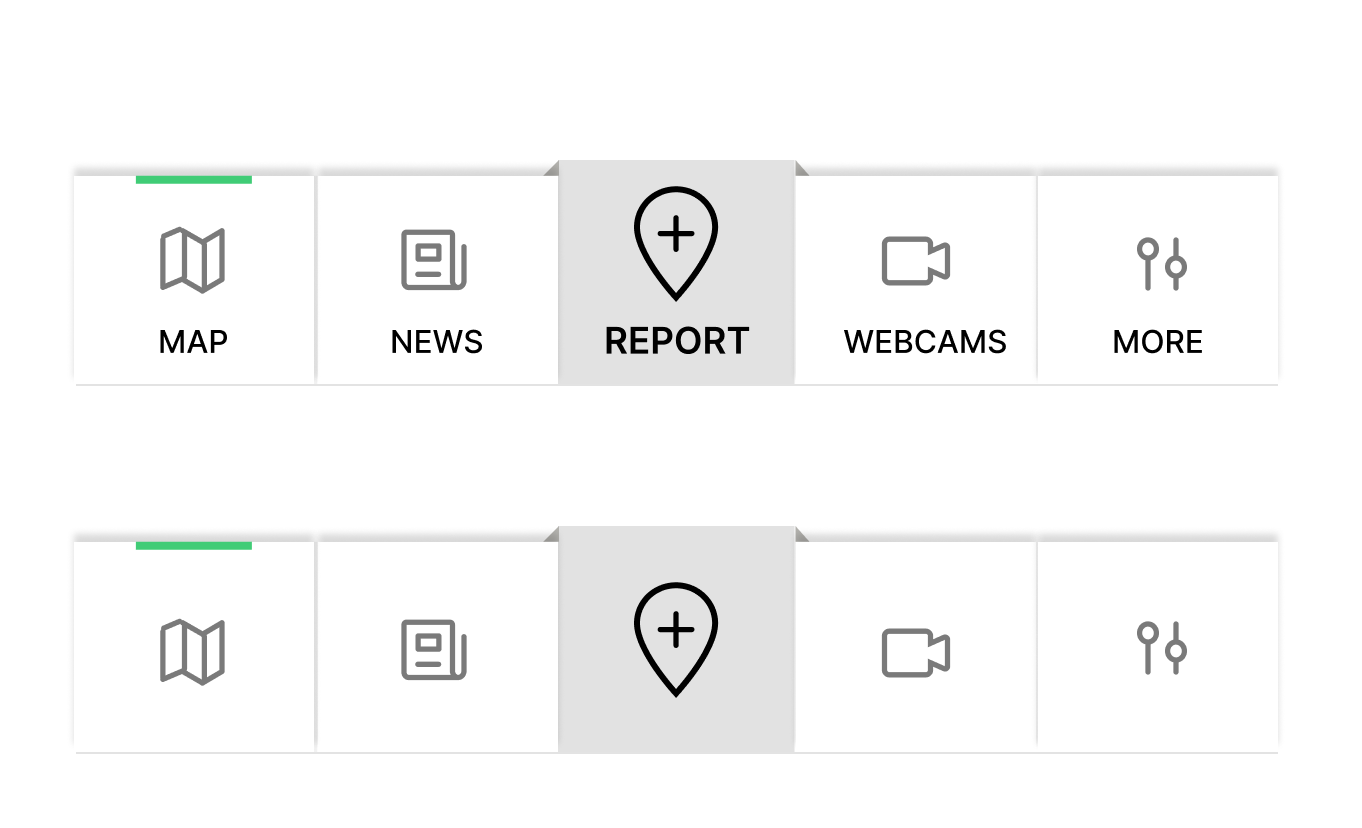
I tested a few variations of the interface, including a minimalist version with only icons. However, during A/B testing, 83% of participants (6 users) chose the menu that featured both text labels and icons, confidently securing our final design direction.
Testing
Throughout the entire project, I was constantly validating ideas, flows, and designs.
To ensure the core functionality was truly intuitive, I conducted formal usability testing with our target demographic using the high-fidelity prototypes.
During these sessions, I was asking participants to complete three specific scenarios:
- Reporting an Incident: Users were asked to quickly report a traffic accident on their current route, testing the efficiency and safety of the reporting flow.
- Checking Live Webcams: Users were tasked with locating and viewing a specific city webcam to check traffic conditions before starting their journey.
- Managing Favorites: Users needed to save a frequently used traffic camera to their favorites list for faster access in the future.
By giving users these specific tasks, I was able to observe micro-interactions in real-time, identify minor friction points, and ensure the final design remained highly intuitive at every step.
89% of participants (8 out of 9) successfully completed all three tasks without any assistance, confirming the app’s usability and effectiveness.Final conclusions
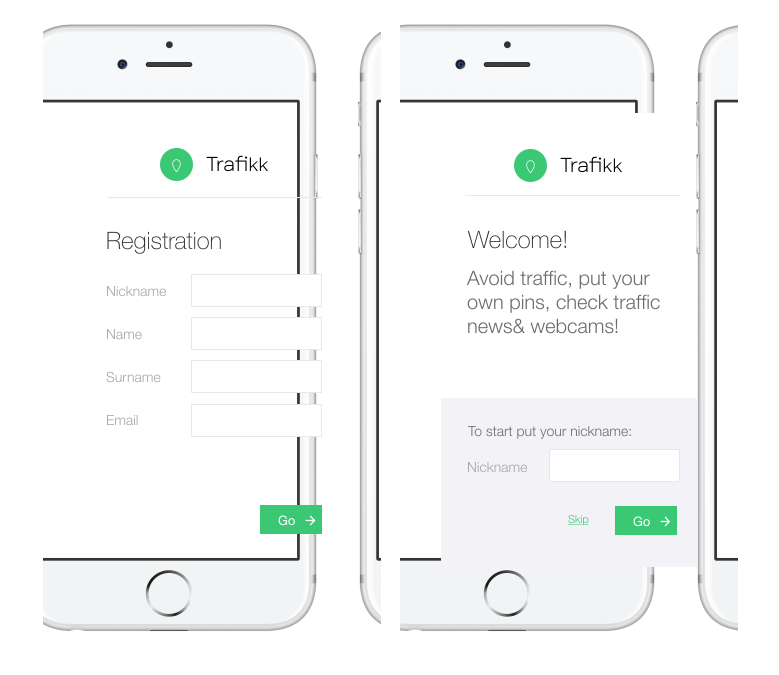
After launch I discovered there was a significant sign-In wall. A logical solution was to allow users to get to know the app before they committed to sign up.
Not only did we allow users to check the app before registration but we also significantly shortened the form. This reduced the drop-off rate by 30%.
Before & After:
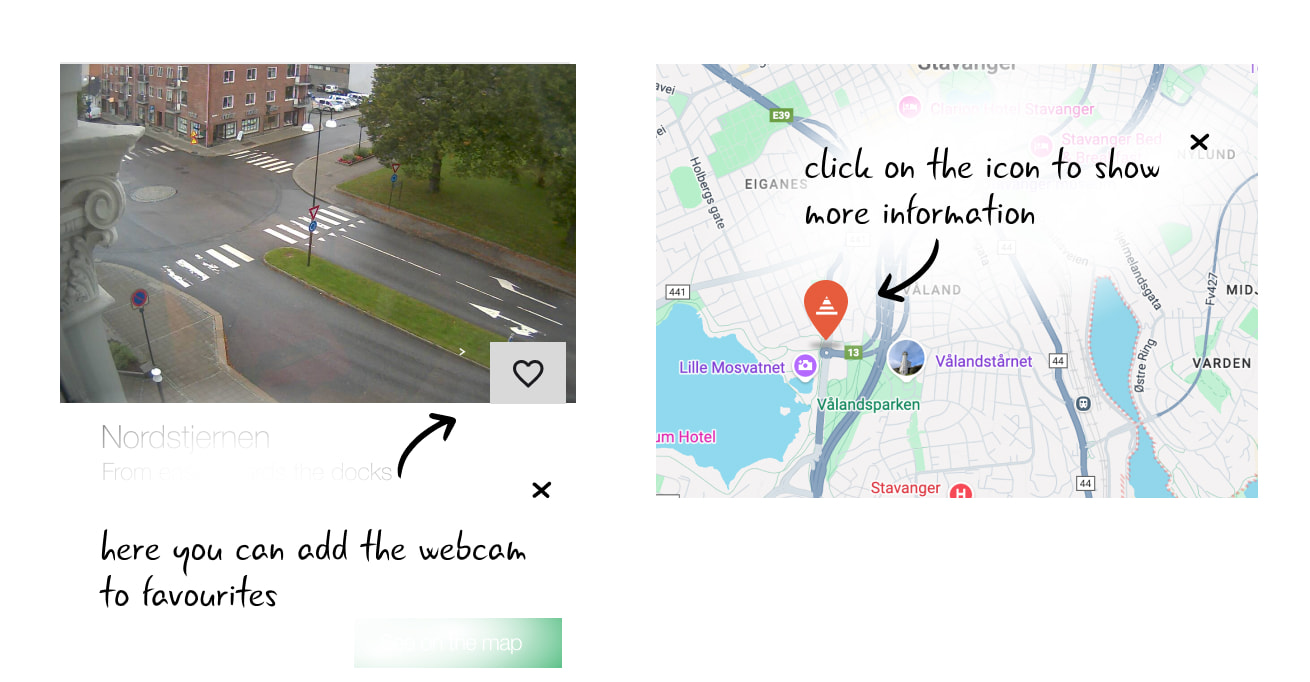
I also decided to get rid of traditional, multi-step onboarding screens - and replace them with some informal tips. Those would be shown to the user after a while and only when they hadn’t discovered something by then.
During post-launch user surveys, another major finding was that users expected route optimization—a feature we hadn't initially prioritized due to technical and budget constraints.
Taking this feedback on board, we continued to update the app after launch. Over time, we rolled out several highly requested features, including a parking spot finder and live train delays.
Final designs